Mike Bostock氏のD3.jsは、Javascriptでインタラクティブなグラフを簡単に作成できる大変すばらしいライブラリです。
このD3.jsが持つ機能のうち、ネットワークグラフ関連の機能をRから簡単に使えるようにしたのがd3Networkです。

パッケージはCRANからインストールすることができます。
install.packages("d3Network")
先ほどのd3Networkのサイトに掲載されている一番簡単なサンプルで試してみます。
library("d3Network")
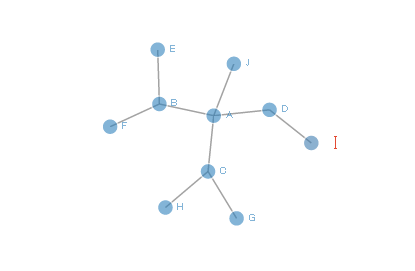
Source <- c ( "A" , "A" , "A" , "A" , "B" , "B" , "C" , "C" , "D" )
Target <- c("B", "C", "D", "J", "E", "F", "G", "H", "I")
NetworkData <- data.frame(Source, Target)
d3SimpleNetwork(NetworkData, width = 400, height = 250)
実行するとHTMLが出力されます。
<!DOCTYPE html>
<meta charset="utf-8">
<body>
<style>
   .link {
   stroke: #666;
   opacity: 0.6;
   stroke-width: 1.5px;
}
.node circle {
   stroke: #fff;
   opacity: 0.6;
   stroke-width: 1.5px;
}
text {
   font: 7px serif;
   opacity: 0.6;
   pointer-events: none;
}
</style>

<script src=http://d3js.org/d3.v3.min.js></script>

<script>
 var links = [ { "source" : "A", "target" : "B" }, { "source" : "A", "target" : "C" }, { "source" : "A", "target" : "D" }, { "source" : "A", "target" : "J" }, { "source" : "B", "target" : "E" }, { "source" : "B", "target" : "F" }, { "source" : "C", "target" : "G" }, { "source" : "C", "target" : "H" }, { "source" : "D", "target" : "I" } ] ;
 var nodes = {}

// Compute the distinct nodes from the links.
links.forEach(function(link) {
link.source = nodes[link.source] ||
(nodes[link.source] = {name: link.source});
link.target = nodes[link.target] ||
(nodes[link.target] = {name: link.target});
link.value = +link.value;
});

var width = 400
height = 250;

var force = d3.layout.force()
.nodes(d3.values(nodes))
.links(links)
.size([width, height])
.linkDistance(50)
.charge(-200)
.on("tick", tick)
.start();

var svg = d3.select("body").append("svg")
.attr("width", width)
.attr("height", height);

var link = svg.selectAll(".link")
.data(force.links())
.enter().append("line")
.attr("class", "link");

var node = svg.selectAll(".node")
.data(force.nodes())
.enter().append("g")
.attr("class", "node")
.on("mouseover", mouseover)
.on("mouseout", mouseout)
.on("click", click)
.on("dblclick", dblclick)
.call(force.drag);

node.append("circle")
.attr("r", 8)
.style("fill", "#3182bd");

node.append("text")
.attr("x", 12)
.attr("dy", ".35em")
.style("fill", "#3182bd")
.text(function(d) { return d.name; });

function tick() {
link
.attr("x1", function(d) { return d.source.x; })
.attr("y1", function(d) { return d.source.y; })
.attr("x2", function(d) { return d.target.x; })
.attr("y2", function(d) { return d.target.y; });

node.attr("transform", function(d) { return "translate(" + d.x + "," + d.y + ")"; });
}

function mouseover() {
d3.select(this).select("circle").transition()
.duration(750)
.attr("r", 16);
}

function mouseout() {
d3.select(this).select("circle").transition()
.duration(750)
.attr("r", 8);
}
// action to take on mouse click
function click() {
d3.select(this).select("text").transition()
.duration(750)
.attr("x", 22)
.style("stroke-width", ".5px")
.style("opacity", 1)
.style("fill", "#E34A33")
.style("font", "17.5px serif");
d3.select(this).select("circle").transition()
.duration(750)
.style("fill", "#E34A33")
.attr("r", 16)
}

// action to take on mouse double click
function dblclick() {
d3.select(this).select("circle").transition()
.duration(750)
.attr("r", 6)
.style("fill", "#E34A33");
d3.select(this).select("text").transition()
.duration(750)
.attr("x", 12)
.style("stroke", "none")
.style("fill", "#E34A33")
.style("stroke", "none")
.style("opacity", 0.6)
.style("font", "7px serif");
}

</script>
</body>>
ブラウザで表示すると以下のようになります。